[Ed. Alexander Kislov and his team are some of Russia’s leading climate scientists]
Interest in the effect of warming temperatures in the Arctic continues to grow, with researchers studying a range of impacts such as reduced sea ice, animal migration, flora changes and overall adaptation. However building an overall picture takes multiple projects and multiple data sources of climatic conditions, atmospheric pressures etc To help, a team of Russia’s leading climate scientists have analysed data from a sub-arctic region of the Barents Sea.
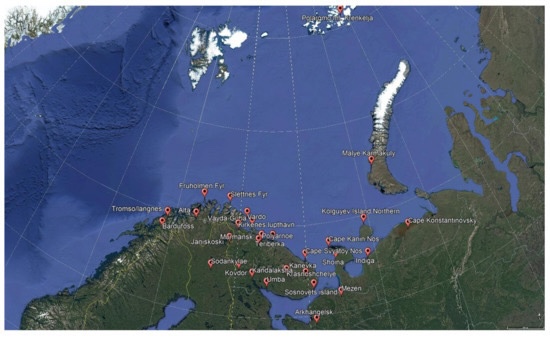
They analysed extreme precipitation on the marine surface and surrounding land in the region during the cold season. Extreme precipitation is also associated with cyclone activity during the warm season. They used a dataset of daily precipitation between 1966–2018 but aware that observation ‘in-situ’ in the Arctic generally is limited so the focus on the specific region could help fill in a gap. They only used open water samples from the western portion of the sea. They focused on open water in the western part of the Barents Sea, because the cold season has precipitation mainly as snow falling on the cold or ice surfaces.
They then used statistical analysis and synaptic modelling to understand any relationships with extreme precipitation and also cyclone activity. (Synoptic models and maps are e.g., in the UK, based on collection of data from weather observation stations
“For instance, hourly temperature is a synoptic observation, but daily maximum and minimum temperature are climate observations; cloud is synoptic but sunshine is climate. Climate observations are made at 0900UTC, with some stations making further climate observations at 2100UTC. In summer these correspond to 1000BST and 2200BST respectively. Observations from around 270 UK automatic (synoptic) stations are collected in real time; climate data from these stations also comes in straight after readings are taken. However, climate observations from around 150 co-operating observers at manual climate stations are received in slower time.” https://www.metoffice.gov.uk/research/climate/maps-and-data/uk-synoptic-and-climate-stations)
They analysed anomalies in the data distribution as part of the statistical analysis. They found fewer anomalies in the eastern region compared to the west, concluding that there is a decrease in cyclone activity the further eastward the data goes. With the synaptic modelling they analysed the circulation / pressure conditions that are related to extreme precipitation, during cyclones e.g. from warm moist air from Atlantic Ocean circulation.
This transfer of air results in polar cyclones. They have found an increase in intensity and occurrence of cyclones as the climate has warmed, also affected by the increase of open water in the Barents Sea. They recommend adjusting statistical analysis to take account of these precipitation anomalies and how they are represented in the data.
Kislov, A., Matveeva, T. and Antipina, U. (2022) ‘Precipitation Extremes and Their Synoptic Models in the Northwest European Sector of the Arctic during the Cold Season’, Atmosphere, 13(7), p. 1116. doi:10.3390/atmos13071116.

